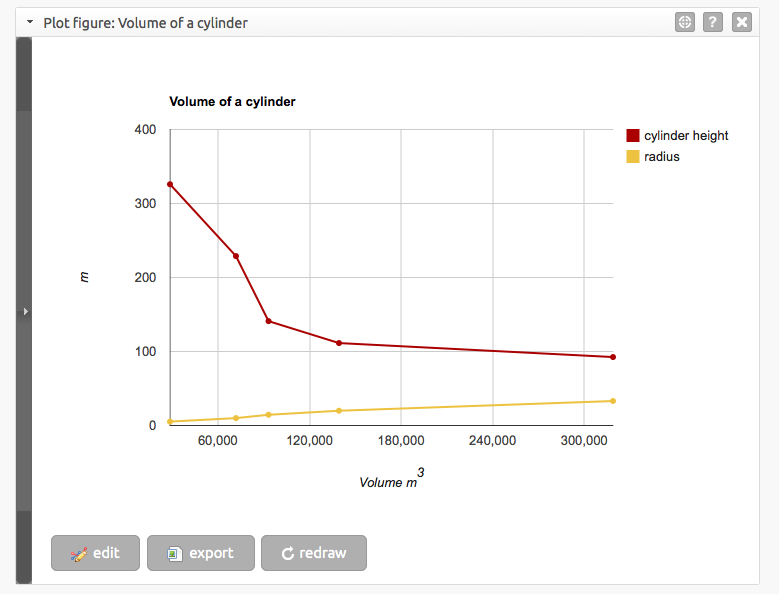
Plotting formulas
A plot figure is a collection of one or more individual plots, and includes all settings such as colors, titles and labels.
Plots can be drawn as a curve, line, or as scatter plots.
Creating plot figures
Make sure the formula you want to plot has at least one array value (otherwise, you would be plotting a single data point instead of a set of data).
Then click on the button next to that formula’s solve button.
Note
Plot figures are not automatically redrawn when the data from its source formulas is changed.
If you ever re-solve a plotted formula or alter its input variables, be sure to press the button to get the plot figure back in sync with its source data.
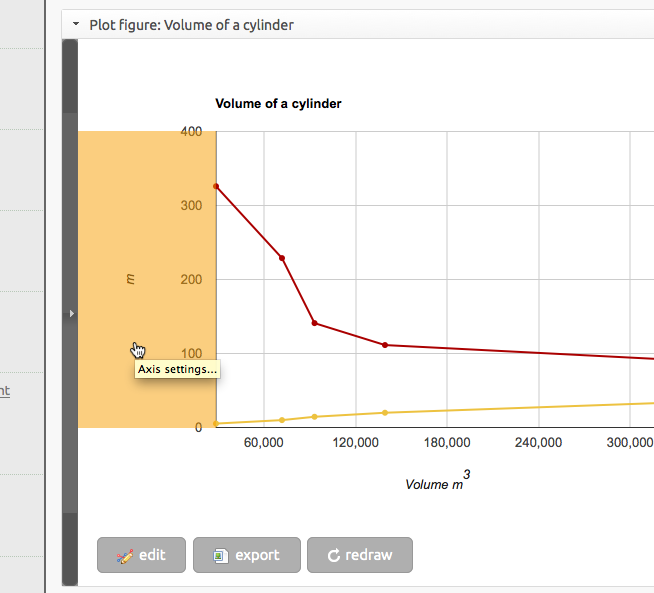
The plot figure’s background will be tinted orange to let you know that it’s out of sync.
Editing plots and figures
If you click on the button, the plot figure’s edit panel will slide out.
Within the edit panel you’ll see a list of the figure’s plots. Clicking on a plot will reveal the settings for that particular plot.
Close the edit panel by clicking on the again.
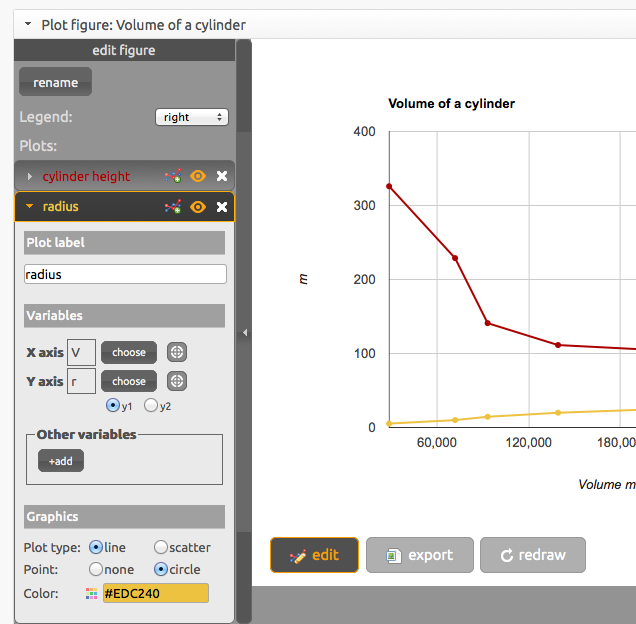
Plot options
Plot label
A plot’s label is what is shown in the figure’s legend.
Note this is distinct from the plot figure’s title.
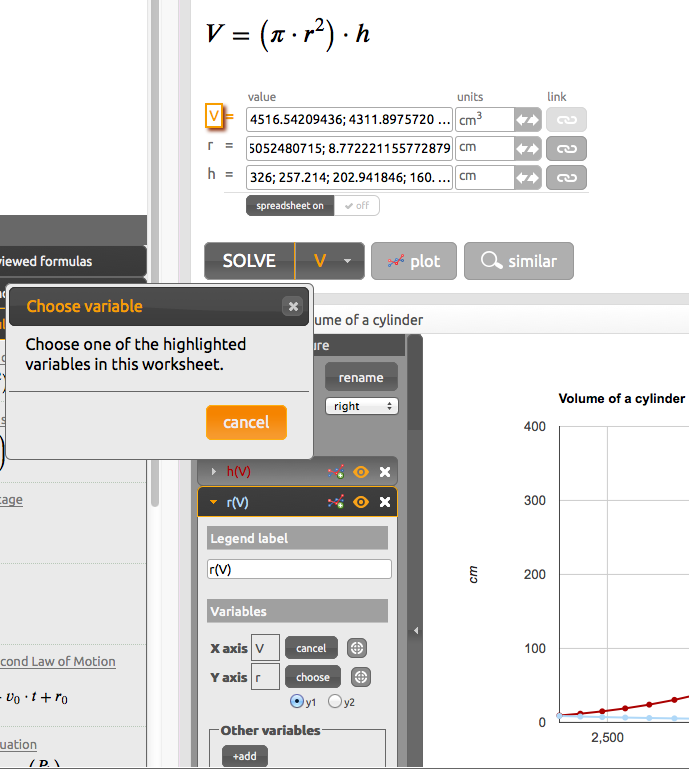
Changing the plotted variables
Under the variables section in the plot’s options, you can view and change the variables used in that plot.
To re-assign another variable to be plotted on a particular axis:
- Click on the button next to the desired axis
- Scroll through the formulas in the Solver until you locate the new variable. Variables you can use in the plot will be outlined orange.
- Click on the desired variable
Note
All plots on a given axis must have compatible units. For example, you can mix variables with meters and centimeters one a single axis. To add a variable with other units such as seconds, you’d have to make use of the 2nd Y-axis.
Multiple Y axes
In the variables section of a plot’s settings, you can see an option to plot its Y-variable on either the y1 (left-hand) or y2 (right-hand) axis.
Line plot, scatter plot, plot color
You can alter a plot’s visual formatting under the graphics section of its settings.
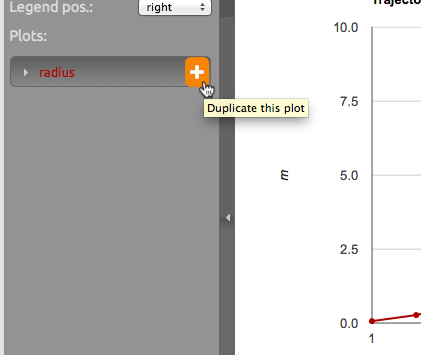
Adding additional plots to a figure
You can add additional plots to a figure is by duplicating one of its existing plots.
Click on the button found in the figure’s list of plots to do this.
After you’ve added the new plot, you can change its variables, colors, etc. as described under Plot options.
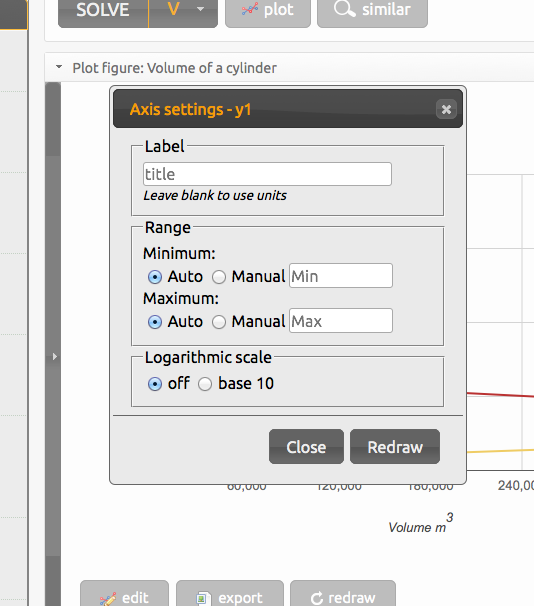
Axis settings
You can change the domain or range and label of a Y- or X-axis, as well as setting it to a logarithmic scale, by clicking on it in the axis itself in the plot figure.
By default, the units of the plotted variables are used as an axis’s label, and the range/domain are determined automatically based on the plotted variables’ values.
Locating the variables used in a plot
It may become hard to remember which variables are used in a plot figure once it becomes somewhat complex, or also if the Solver has many different objects.
The Solver can show you the variables used in a particular plot if you click on the button in the figure’s header bar.
This button also exists in the plot settings next to the vars used in the plot. Clicking it just shows you that one particular variable instead of all variables in the plot figure.
Just click on the screen anywhere when you’re done, or press the escape key on your keyboard.
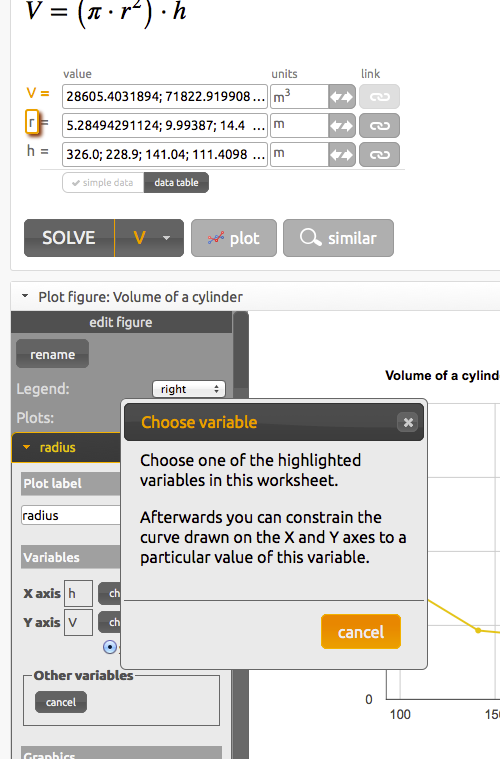
Constraint variables (3-D slices)
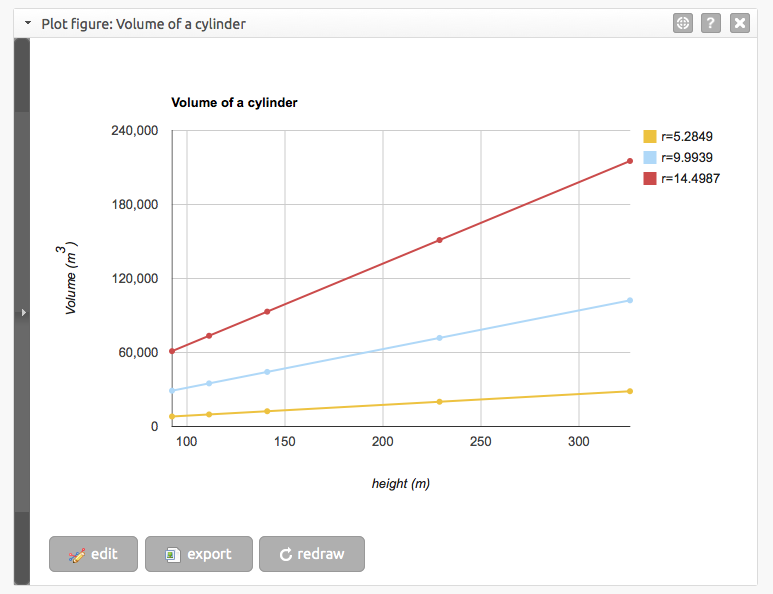
While true 3-dimensional plots are not supported, it is possible to mimic their effects by constraining a plot curve to variables other than those plotted on the Y- and X-axes.
In the example, the formula for the volume of a cylinder has three variables, V, h, and r (volume, height, and radius). You can view changes in the plot of V against h when r is set to particular values. Each particular value of r represents a slice of the plot V against h against r, had it been graphed in 3 dimensions.
To add a constraint variable:
Open the settings for a particular plot as described above.
In the other variables box click on the button.
- The Solver will stop here with a warning if it can’t locate any variables that can be used as constraint variables
Scroll through the Solver to locate the desired constraint variable
Click on the variable
Select a particular value for the new constraint variable using the slider in the other variables box
Note you are not restricted to using just a single constraint variable (i.e. a 3rd dimension).
Adding additional slices
To view additional 3-D slices, duplicate a plot with a constraint variable and select a different value for the constraint variable.